In the first of a four-part series, Daily Herald reporter Melissa Silverberg and WBEZ's Linda Lutton take a look at poverty and education in Illinois. Their studies of state testing over the last decade revealed that the schools with the most low-income students performed the worst. Silverberg and Tim Broderick, data analyst and graphic designer for the project, join us tonight to share their results of the state Poverty-Achievement gap.
The Daily Herald Poverty-Achievement Index compares schools with similar percentages of low-income students. Find out how schools compare in your district and view interactive graphics of key statistics of schools going back to 2004.
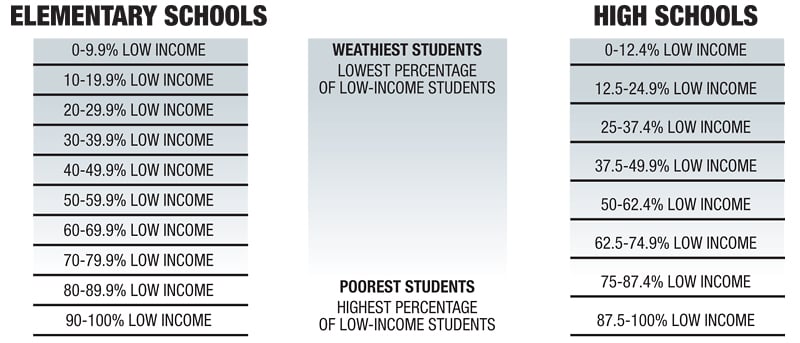
The Poverty-Achievement Index was calculated based on Illinois School Report Card results from 2004 to 2014. For each year, the Daily Herald separated schools that reported ISAT results (elementary and middle schools) from high schools that reported PSAE results. Elementary schools were separated into 10 income ranges and high schools were separated into eight ranges. View a chart of those ranges below.
View an interactive graphic of elementary school results. Scroll over the chart to see results for each income level by year.
View an interactive graphic of high school results. Scroll over the chart to see results for each income level by year.
")

")
")
")
)")
